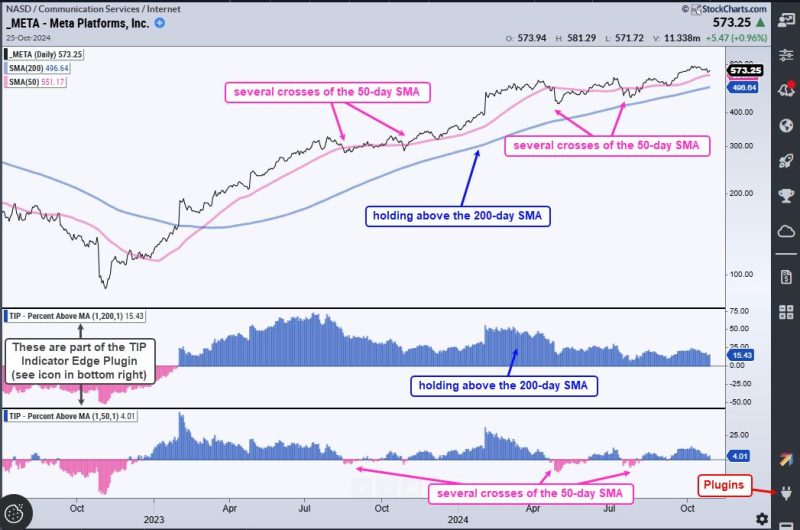
In a constantly shifting financial landscape where markets can be volatile and unpredictable, it is essential for traders and investors to constantly seek methods to enhance their edge. By staying informed and utilizing effective strategies, individuals can increase their chances of making successful investment decisions. In this article, we will explore two key indicators that can assist in improving your edge in the market.
1. **Moving Averages:** Moving averages are a widely used technical indicator that can provide valuable insights into market trends and price movements. By calculating the average price of an asset over a specific period, moving averages help smooth out fluctuations and reveal underlying trends.
– **Simple Moving Average (SMA):** SMA is a basic form of moving average calculation that takes the sum of closing prices over a specified period and divides it by the number of periods. Traders often use SMAs to identify potential trend reversals or support and resistance levels.
– **Exponential Moving Average (EMA):** EMA gives more weight to recent price data, making it more responsive to current market conditions compared to the SMA. Traders use EMAs to capture short-term trends and anticipate potential price breakouts.
By analyzing moving averages, traders can gain valuable insights into market sentiment and potential turning points, thereby improving their decision-making process.
2. **Relative Strength Index (RSI):** The RSI is another valuable indicator used to measure the speed and change of price movements in the market. It oscillates between 0 and 100 and is commonly employed to identify overbought or oversold conditions in an asset.
– **Overbought and Oversold Levels:** When the RSI exceeds 70, it indicates that an asset may be overbought, suggesting a potential reversal or correction. Conversely, an RSI reading below 30 implies oversold conditions, indicating a possible buying opportunity.
– **Divergence:** Divergence occurs when the RSI moves in the opposite direction of the asset’s price trend, signaling a potential shift in momentum. By paying attention to divergences, traders can anticipate reversals and make informed trading decisions.
Incorporating the RSI into your technical analysis toolkit can help you gauge market conditions, identify potential entry and exit points, and refine your trading strategy for better outcomes.
In conclusion, by leveraging indicators such as moving averages and the relative strength index, traders can enhance their edge in the market and make more informed decisions. These tools provide valuable insights into price trends, market sentiment, and potential turning points, empowering individuals to navigate the complexities of the financial markets with greater confidence and proficiency. By embracing continuous learning and adopting effective strategies, traders can improve their skills and increase their chances of achieving success in their investment endeavors.

